
Registrations Report

The Registrations Report helps you understand how families are engaging with your activities so you can plan your offerings more effectively. This report includes data on registrations, participants, waitlist conversions, and cancelation rates—giving you a clearer picture of your community’s interests. This article will walk you through how to use the Registrations Report.
👉 Want to see how much money you’ve earned and received? Check out the Payoffs Report.
👉 Want to gain insights into your business’s financial performance? Check out the Revenue Report.
Overview cards: How is overall engagement?
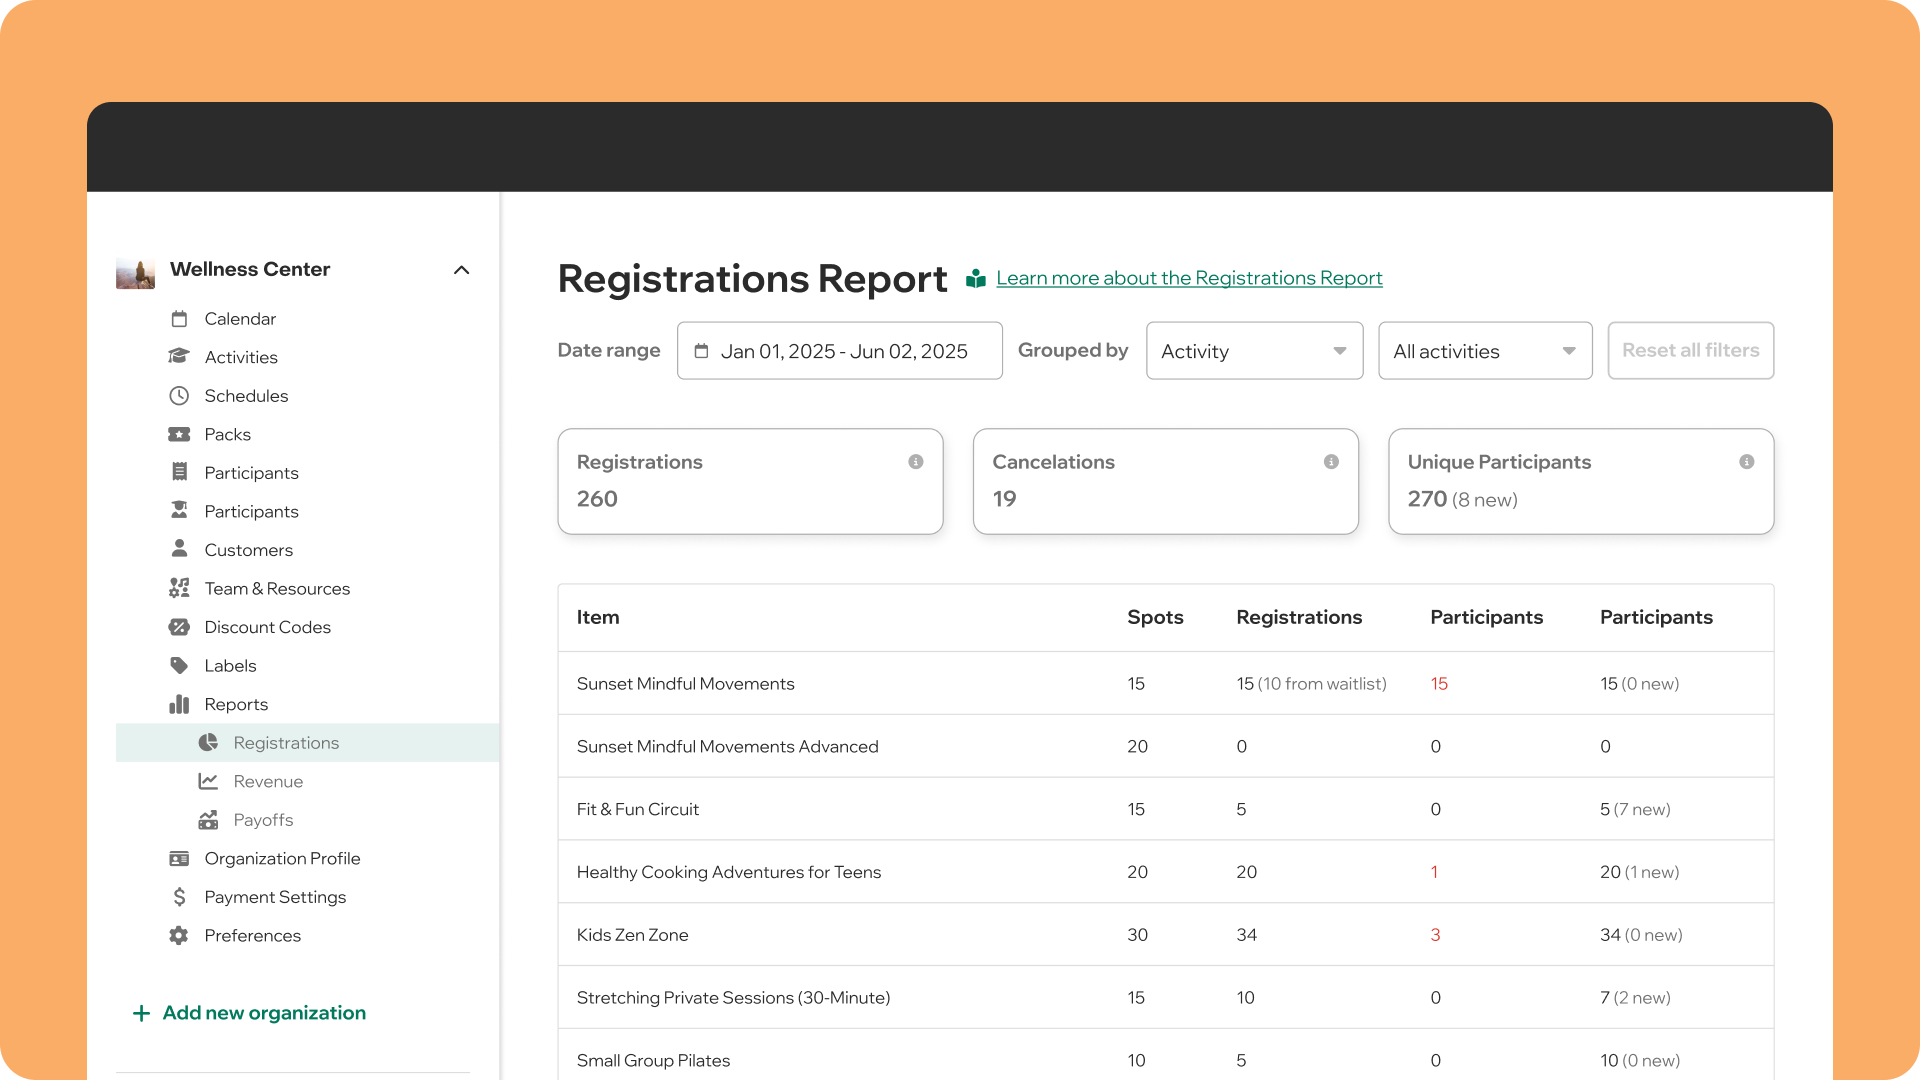
At the top of the Registrations Report, you’ll find overview cards showing key stats for the time period you’ve selected. Here’s what each card means:
- Registrations: The total number of registrations, including those that were later canceled. This count includes any registrations made by participants as well as any orders you created on behalf of families.
- Cancelations: The total number of canceled registrations, including those where participants were removed from the roster by you or your staff.
- Unique participants: The total number of unique participants who have signed up. Even if a registration was later canceled, it still counts here. In parentheses, you’ll see how many of these participants registered for one of your activities for the first time.
In the table below, you can compare the number of registrations collected with the number of spots you offered, helping you evaluate your fill rate and plan future offerings. You can also evaluate the impact your waitlists have on the fill rate.

Date range: How is participation evolving?
Use the date filter to choose the time period you want to analyze. You can view your numbers for last week, last month, last year, or any custom date range.
💡 Pro tip: Want to compare how your registrations evolving over time? Use the split screen to view two different date ranges side by side.
Group by: Which offerings are the most popular?
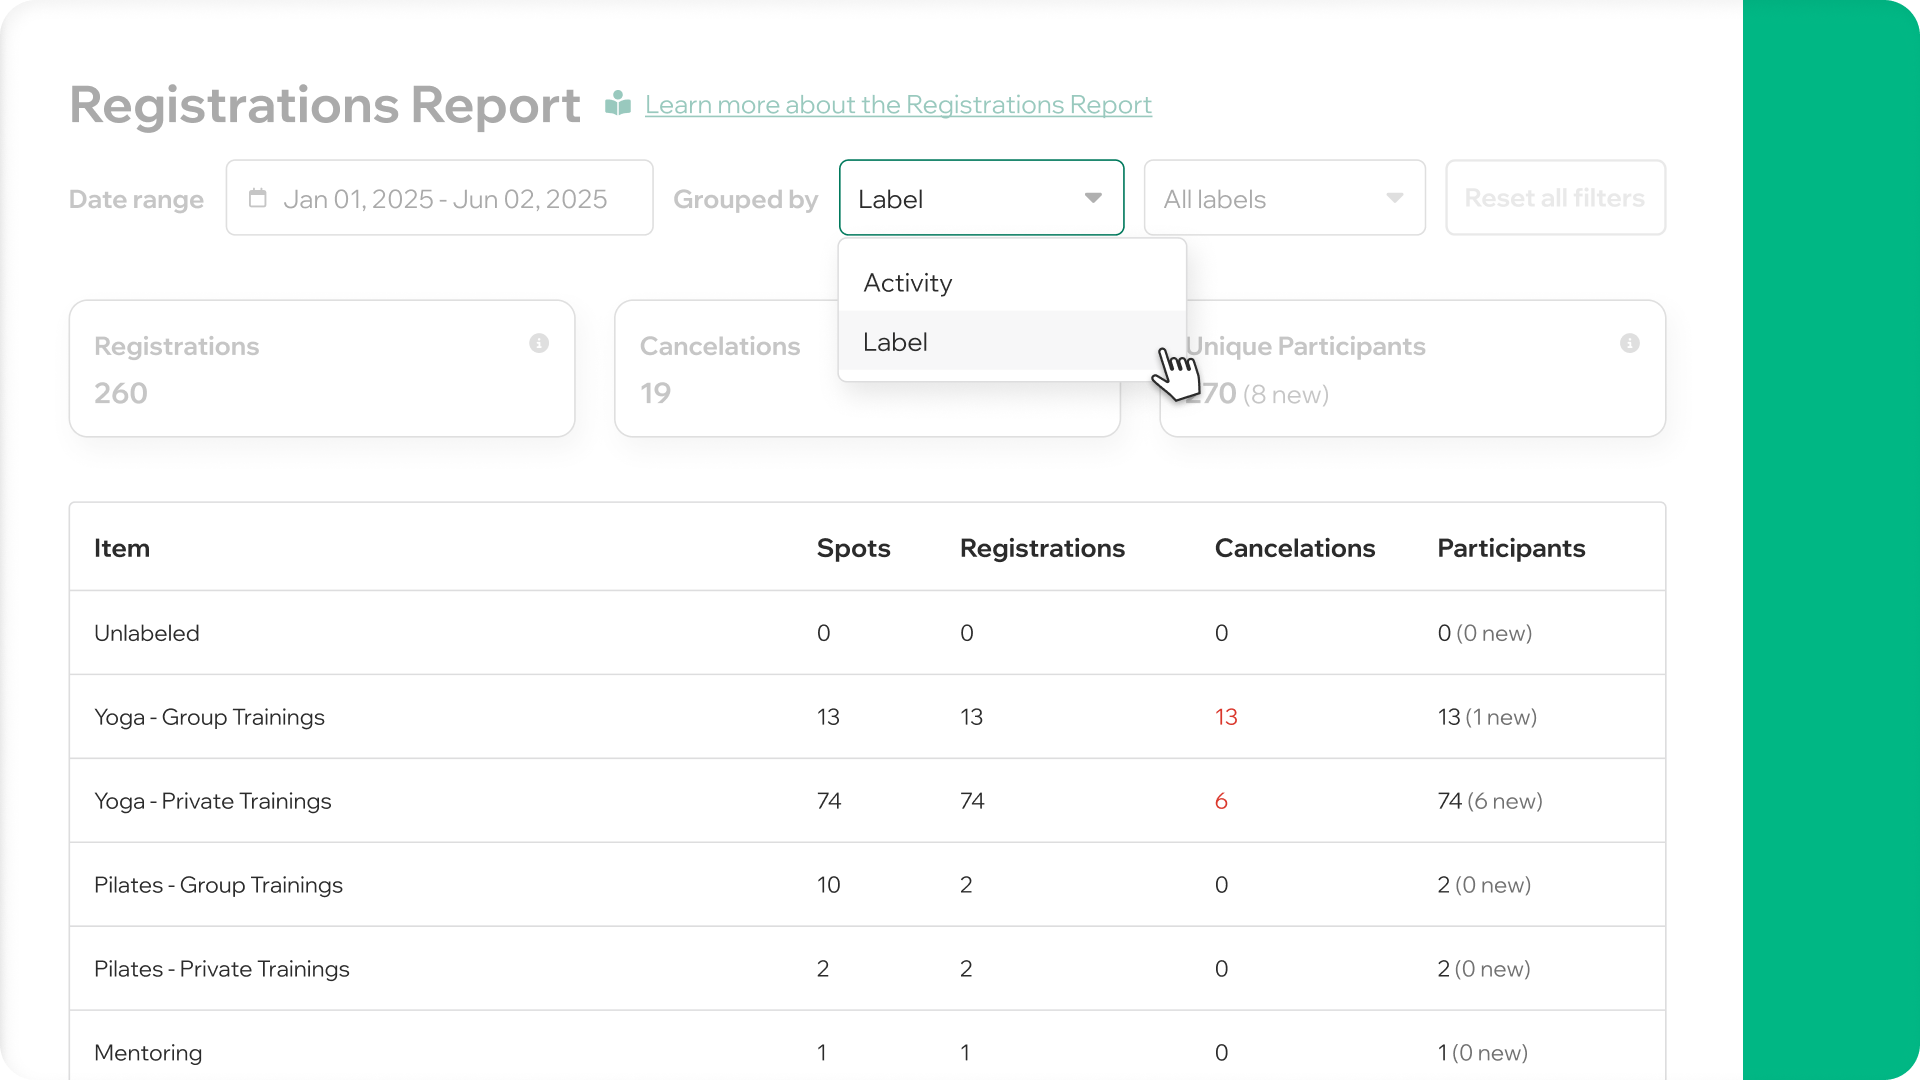
You can select the level of detail you’d like to see in your breakdown:
- View the performance of each activity individually.
- Or aggregate them by label for a broader overview.
The overview cards at the top will always show the total counts, no matter how you choose to group the data.
👉 Not using labels yet? Learn how to get started.
We value your feedback! Please reach out with any suggestions on how to enhance this feature. We'd love to hear how you’re using the reporting feature and what improvements you'd like to see.

